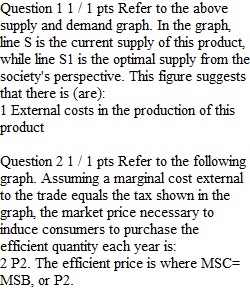
Q Question 1 1 / 1 pts Refer to the above supply and demand graph. In the graph, line S is the current supply of this product, while line S1 is the optimal supply from the society's perspective. This figure suggests that there is (are): Question 2 1 / 1 pts Refer to the following graph. Assuming a marginal cost external to the trade equals the tax shown in the graph, the market price necessary to induce consumers to purchase the efficient quantity each year is: Question 3 1 / 1 pts Refer to the diagram, in which S is the market supply curve and S1 is a supply curve comprising all costs of production, including external costs. Assume that the number of people affected by these external costs is large. If the government wishes to establish an optimal allocation of resources in this market, it should IncorrectQuestion 4 0 / 1 pts Refer to the above supply and demand graph. S1 and D1 represent the current market supply and demand, respectively. S2 and D2 represent the socially optimal supply and demand. One way that the government could shift demand to its socially optimal level is to: Question 5 1 / 1 pts Refer to the diagrams for two separate product markets. Assume that society's optimal level of output in each market is Q0 and that government purposely shifts the market supply curve from S to S1 in diagram (a) on the left and from S to S2 in diagram (b) on the right. The shift of the supply curve from S to S1 in diagram (a) might be caused by a per-unit
View Related Questions